
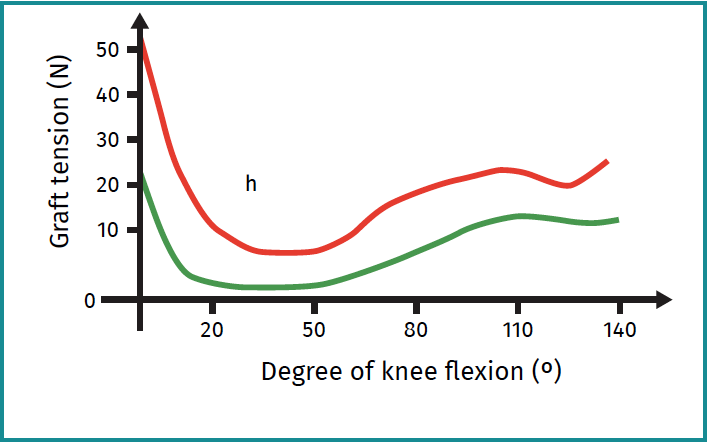
Figure 6. Mean graft stress variations. The green line represents the stress variations suffered by the graft during the range of motion of the knee under "isometric behavior" conditions. The red line represents the stress pattern experienced by the graft with anterior location of the femoral tunnel, presenting significantly increased values in the range of motion of 80-120º.